With football season being completely over (still not over the double doink Cody Parkey!), I was curious about how far the Bears offense had come over the past few years. We went from having Jay Cutler and Alshon Jeffery to Mitch Trubisky and Allen Robinson. It seemed like the Bears were much better at spreading the ball around and it got me thinking that this would be a good data set to look at for my next Tableau chart – the dual axis chart.
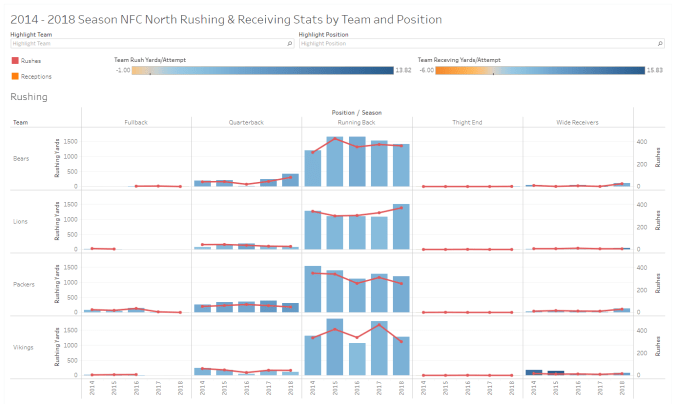
I took all four of the teams in the NFC North (Bears, Lions, Packer, and Vikings) and looked at the number of rushing/receving yards they each had (the left axis) and the number of rushes/receptions that year (right axis). I added yards per rushes/receptions and touchdowns as a measure of effeciency. In the future, I might edit this to add in a visualiztion to the tooltip to add in the top 3 players in each category. While I was not too surprised by what the data showed, it did point out some interesting info that I might look into in other visualizations.
Check out the chart here: Dual Axis Chart
All Data pulled from Pro Football Reference