It has been a while since I have been able to post about the next chart type in Ryan Sleeper’s book Practical Tableau. I took a weekend to do some brewing and then took a trip to Louisville. But I am back this week thinking about the NFL.
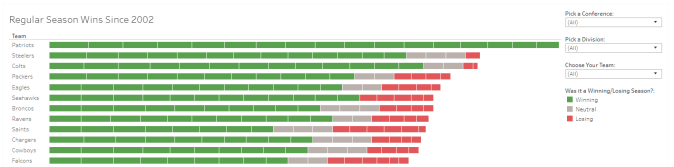
Free agency began this week and it had me thinking about how good times might have gotten or worse for some (what are the Giants THINKING). It got me thinking about how dominant teams have been over the past 10 years so I did some digging. In 2002, the NFL expanded to 32 teams and I thought that would be a good place to start. I wanted to see how many wins each team has had during that time. I knew the Patriots had been dominant but I was surprised by just how much. So the length of the bar is the total number of wins the team has since 2002. Each bar is the size of the wins in that season and the color was for if it was a winning or losing season. If you choose between a few teams, you will see more of the tree map qualities.
Some interesting things that I found:
- The Patriots have not had a losing season
- Patriots have won a total of 207 games, the Browns have won 83
- The Bills highest season win total since 2002 – 9 games in 2004
- The teams at the top have very little in changes at Head Coach/QB1
Here is the link to my visualization: How Dominant have the Patriots Really Been?

You must be logged in to post a comment.