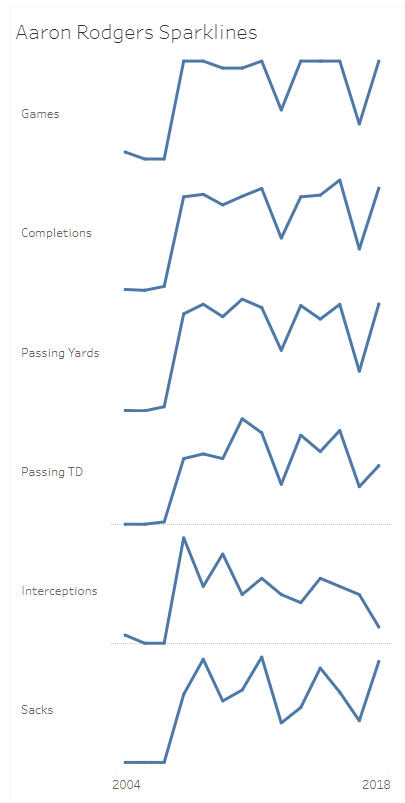
I’ll be honest, I had never heard of sparklines as a visualization before. I was a little skeptical at first that any information could be gleamed from them. But as Ryan says in his book, they are meant to be a very high level and possibly point out areas were you drill down later. I thought about that concept and started to think about a fantasy football dashboard that I would like to make. On the left rail of the dashboard would be a good place to show how this player has trended for the metrics that are important to them. Since my Chicago Bears only have a QB that has been on the team for 2 seasons, I had to turn my attention to the team to the north and look at his season stats. I think the biggest things that I could quickly see is he has been injured in 2 seasons (dips in games played) and his interceptions have steadily decreased. One place that might give me pause (even though he is probably a top QB drafted) is his passing TDs in 2018. Competions and passing yards jumped up after being injured but the TD did not. Just something to think about in 2019.
Aaron Rodgers Season Level Stats
Data Source: Pro Football Reference
