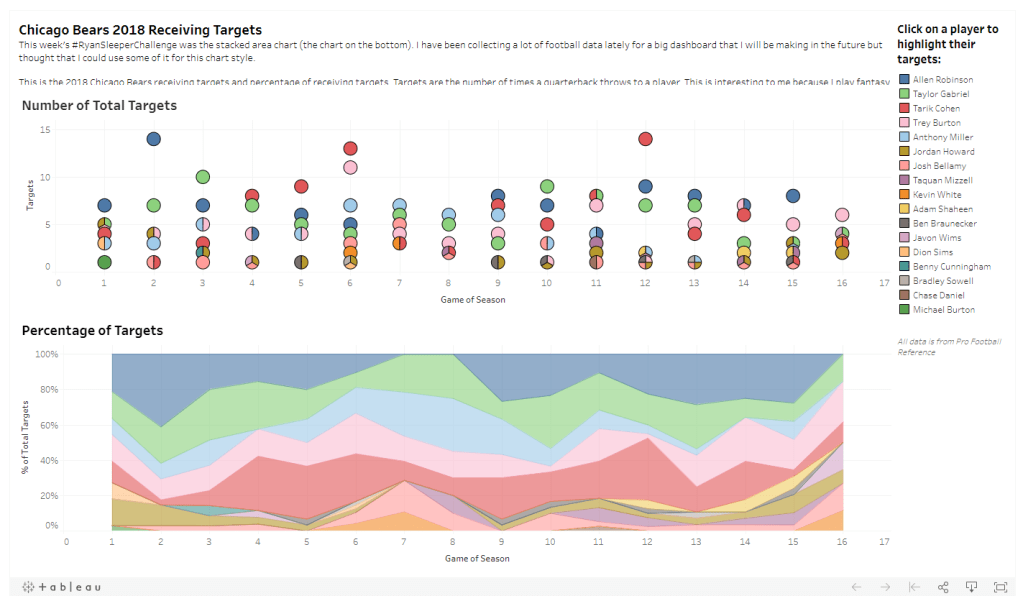
Well the Bears pulled out an ugly win in Denver this weekend. This week in my “challenge”, I created a dashboard around the 2018 Chicago Bears and the receiving targets. I have actually been collecting data on all of the teams in the NFL for the past 5 years to develop an in-depth fantasy football dashboard (think capstone project). I was curious to see who was getting balls thrown to them. Since the Bears had a high powered offense, usually that means the ball is being spread around. I used a stacked area bar chart to show the percentage to total targets each player had over the course of the season. I added another chart to show the volume of targets each receiver had. It is one thing to have 30% of the targets in a week but if that is 5, that isn’t great. In fact, only 5 times did a single player have 10 or more targets in a game (Tarik Cohen did it twice, Allen Robinson, Trey Burton and Taylor Gabriel did it once). If you click on the link below, you are able to click on a players name and it will highlight their data in the two charts.
Check out the dashboard: Chicago Bears 2018 Receiving Targets